

Decoding the cryptocurrency market can feel daunting initially, especially if you are new to digital assets. Crypto charts are filled with terms, graphs, and indicators that might seem like a different language altogether. But fear not—with the proper guidance, you can learn to interpret these charts and use them to make informed investment decisions.
This beginner’s guide will teach you how to read cryptocurrency market charts, explain the key components, and how to leverage this knowledge to master cryptocurrency market analysis.
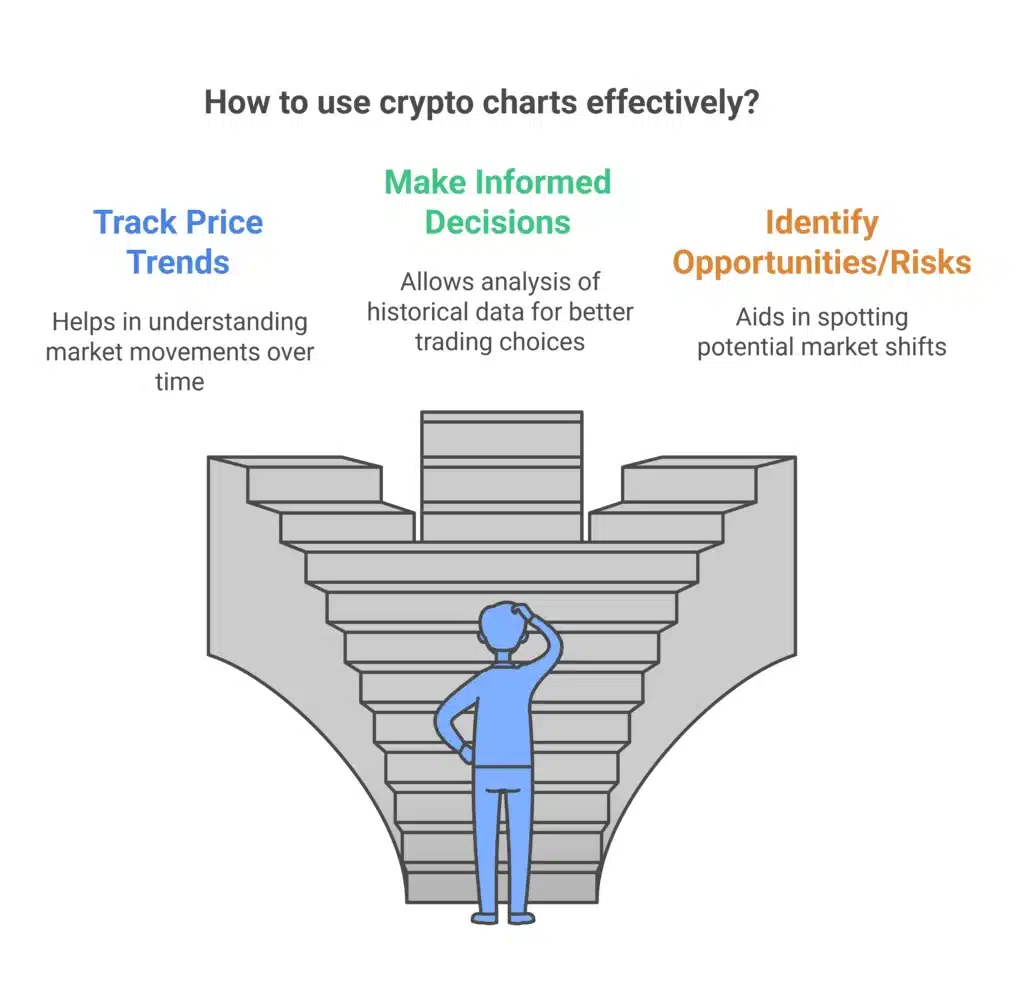
Why Reading Crypto Charts Is Important
Before we get into the nitty-gritty, it’s essential to understand why reading crypto charts is a fundamental skill. Cryptocurrencies are volatile, and their prices can change drastically in minutes. Reading market charts allows you to:
- Track price trends over time.
- Make informed trading decisions by analyzing historical data.
- Identify opportunities and risks in the market.
- Determine the best times to buy or sell the cryptocurrency you want.
Mastering crypto charts is non-negotiable if you want to be a confident investor.
Components of Cryptocurrency Market Charts
You’ll spot several key elements when you first glance at a cryptocurrency chart. Familiarizing yourself with them will give you the foundation to interpret the more advanced aspects.
Price Candlesticks – The Basics of Understanding Market Movements
One of the first things you’ll notice on a chart is the candlestick patterns. Due to their wealth of information, they are widely used in cryptocurrency market analysis.
What do candlesticks show?
- Opening price
- Closing price
- The highest price reached during the timeframe
- Lowest price during the timeframe
Each candlestick has a body and wicks (or shadows). A green candlestick (or white in some charts) signifies a price increase, while a red candlestick indicates a decrease.
By analyzing these candlesticks, you can determine whether the market is bullish (upward-moving) or bearish (downward-moving).
Volume Bars – Monitoring Trading Activity
Underneath the candlesticks, you often see a bar graph representing trading volume. The volume shows how much cryptocurrency is traded during a specific period.
Why is volume essential?
- High trading volumes often indicate high confidence and strong trends.
- Low trading volumes might signal indecision or weakening trends.
For beginners, keeping an eye on volume can provide clues about the strength of the current market movement.
Timeframes – Choosing the Scale of Your Analysis
Crypto charts allow you to analyze data across different timeframes, such as 1 minute, 1 hour, 1 day, or even several months.
Why does this matter?
- Short timeframes are ideal for day traders looking to capture quick gains.
- Longer timeframes are better for identifying long-term trends and making strategic investments.
Understanding which timeframe aligns with your investment goals helps you avoid unnecessary confusion and focus on the data that matters most.
Beginner’s Guide to Crypto Indicators
Indicators are invaluable tools that help you predict cryptocurrency market trends more accurately. But which ones should you focus on as a beginner? Below are a few key indicators commonly used in cryptocurrency market analysis.
Moving Averages (MA)
Moving averages smooth out price fluctuations, making it easier to spot trends.
- Simple Moving Average (SMA): Calculates the average price over time.
- Exponential Moving Average (EMA): Gives more weight to recent price data, making it more responsive to price changes.
Many traders look for “golden crosses” (when a short MA crosses above a long MA) as a bullish signal or “death crosses” for bearish signals.
Relative Strength Index (RSI)
The RSI measures the momentum of price movements on a scale of 0 to 100.
- Above 70: The asset is potentially overbought and ready for a price correction.
- Below 30: The asset is oversold and may be due for a price rebound.
RSI is one of the simplest yet most effective tools for analyzing cryptocurrency trends.
Bollinger Bands
Bollinger Bands consist of an SMA and two standard deviation lines that create a “band” around the price.
- When the band widens, it signals increased volatility.
- When the band tightens, it suggests lower volatility and potential upcoming price movement.
Using Bollinger Bands, you can better assess when a cryptocurrency enters overbought or oversold territory.
Tools for Reading Crypto Charts
There are multiple platforms available for analyzing cryptocurrency charts. Some popular ones include:
- TradingView: Known for its customizable charts and diverse range of indicators.
- CoinMarketCap: Tracks prices, volumes, and trends across multiple cryptocurrencies.
- Binance: Offers built-in charting tools directly on the trading platform.
Experimenting with different platforms will help you find the one that best suits your trading style and preferences.
Common Mistakes to Avoid
Relying Solely on One Indicator
While indicators can be powerful tools, relying too heavily on one can yield inaccurate results. Always use a combination of indicators to confirm trends.
Ignoring Market Sentiment
News, social media, and global events heavily influence crypto markets. Market sentiment can often override technical analysis, so stay informed.
Speculative FOMO
Many beginner investors fall into the trap of “fear of missing out” (FOMO), buying a cryptocurrency at its peak. Stay disciplined and stick to your analysis.
Develop Confidence Through Practice
Learning to read cryptocurrency market charts is a skill that improves with experience. Start small, practice regularly, and keep building your knowledge. Use simulated accounts or paper trading to experiment without real financial risk, and gradually apply your learnings to live markets when ready.
Empower Your Investment Journey
Mastering the art of reading cryptocurrency market charts can transform you from a casual investor into a strategic decision-maker. With the tools and tips in this beginner’s guide, you’ll be better equipped to decode the complexities of crypto trading.
Start exploring crypto charts today, and take control of your investment future.